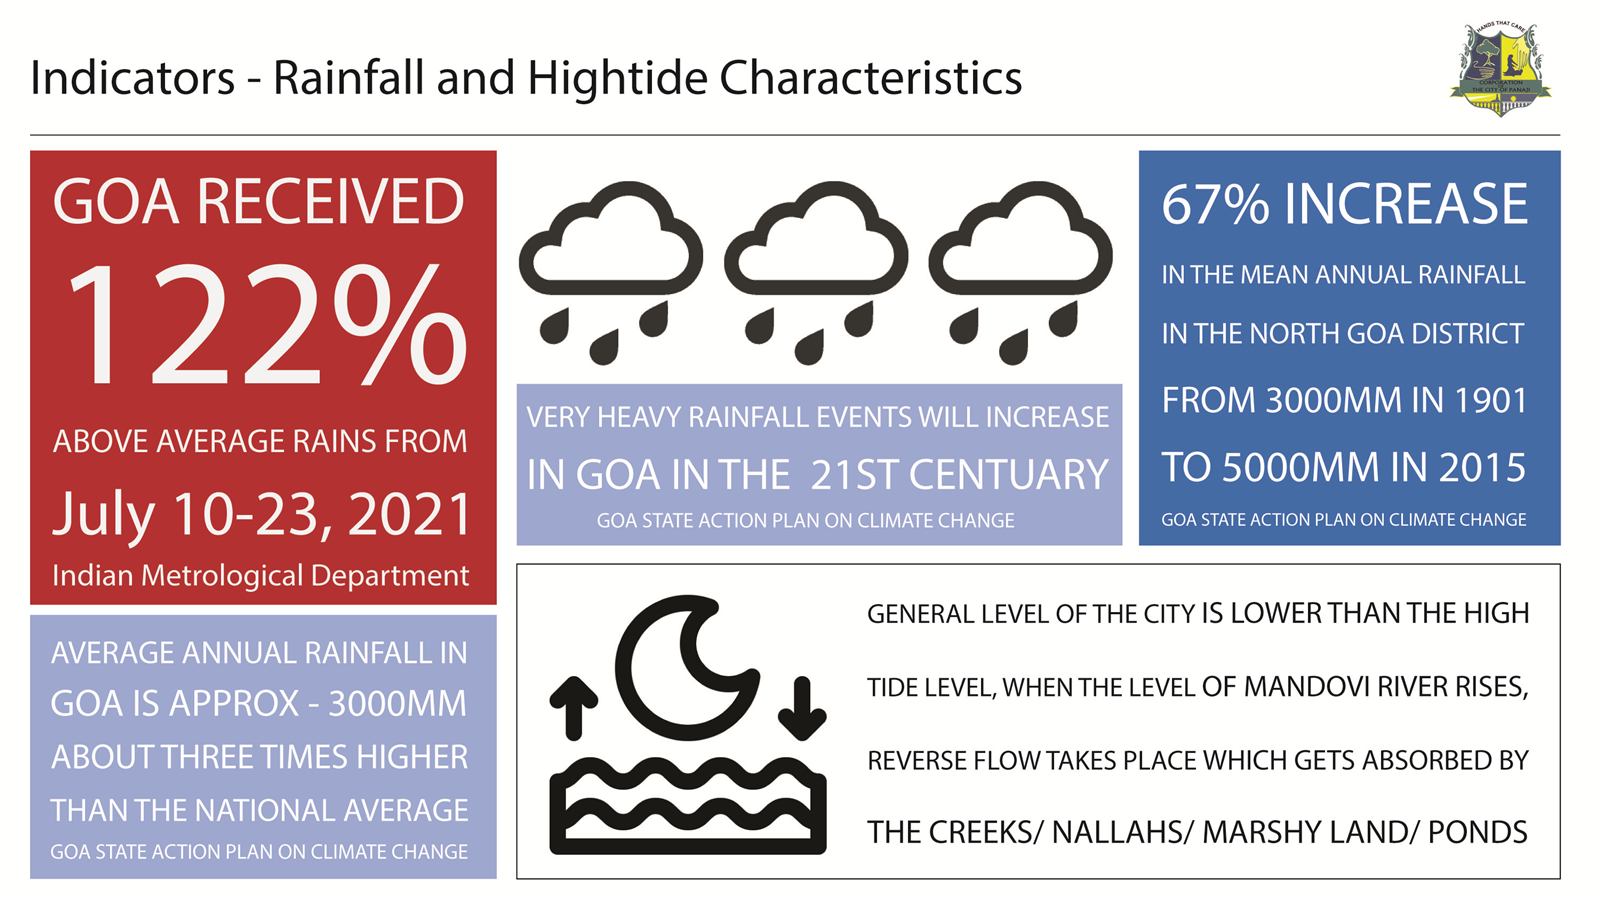
Panaji floods more often, and harder, than it used to. Rapid urbanisation, encroachment on natural drainage and stormwater systems that can't cope have turned heavy rain into standing water. This study set out to find exactly where the city floods, understand why, and propose targeted fixes.
Walking the monsoon
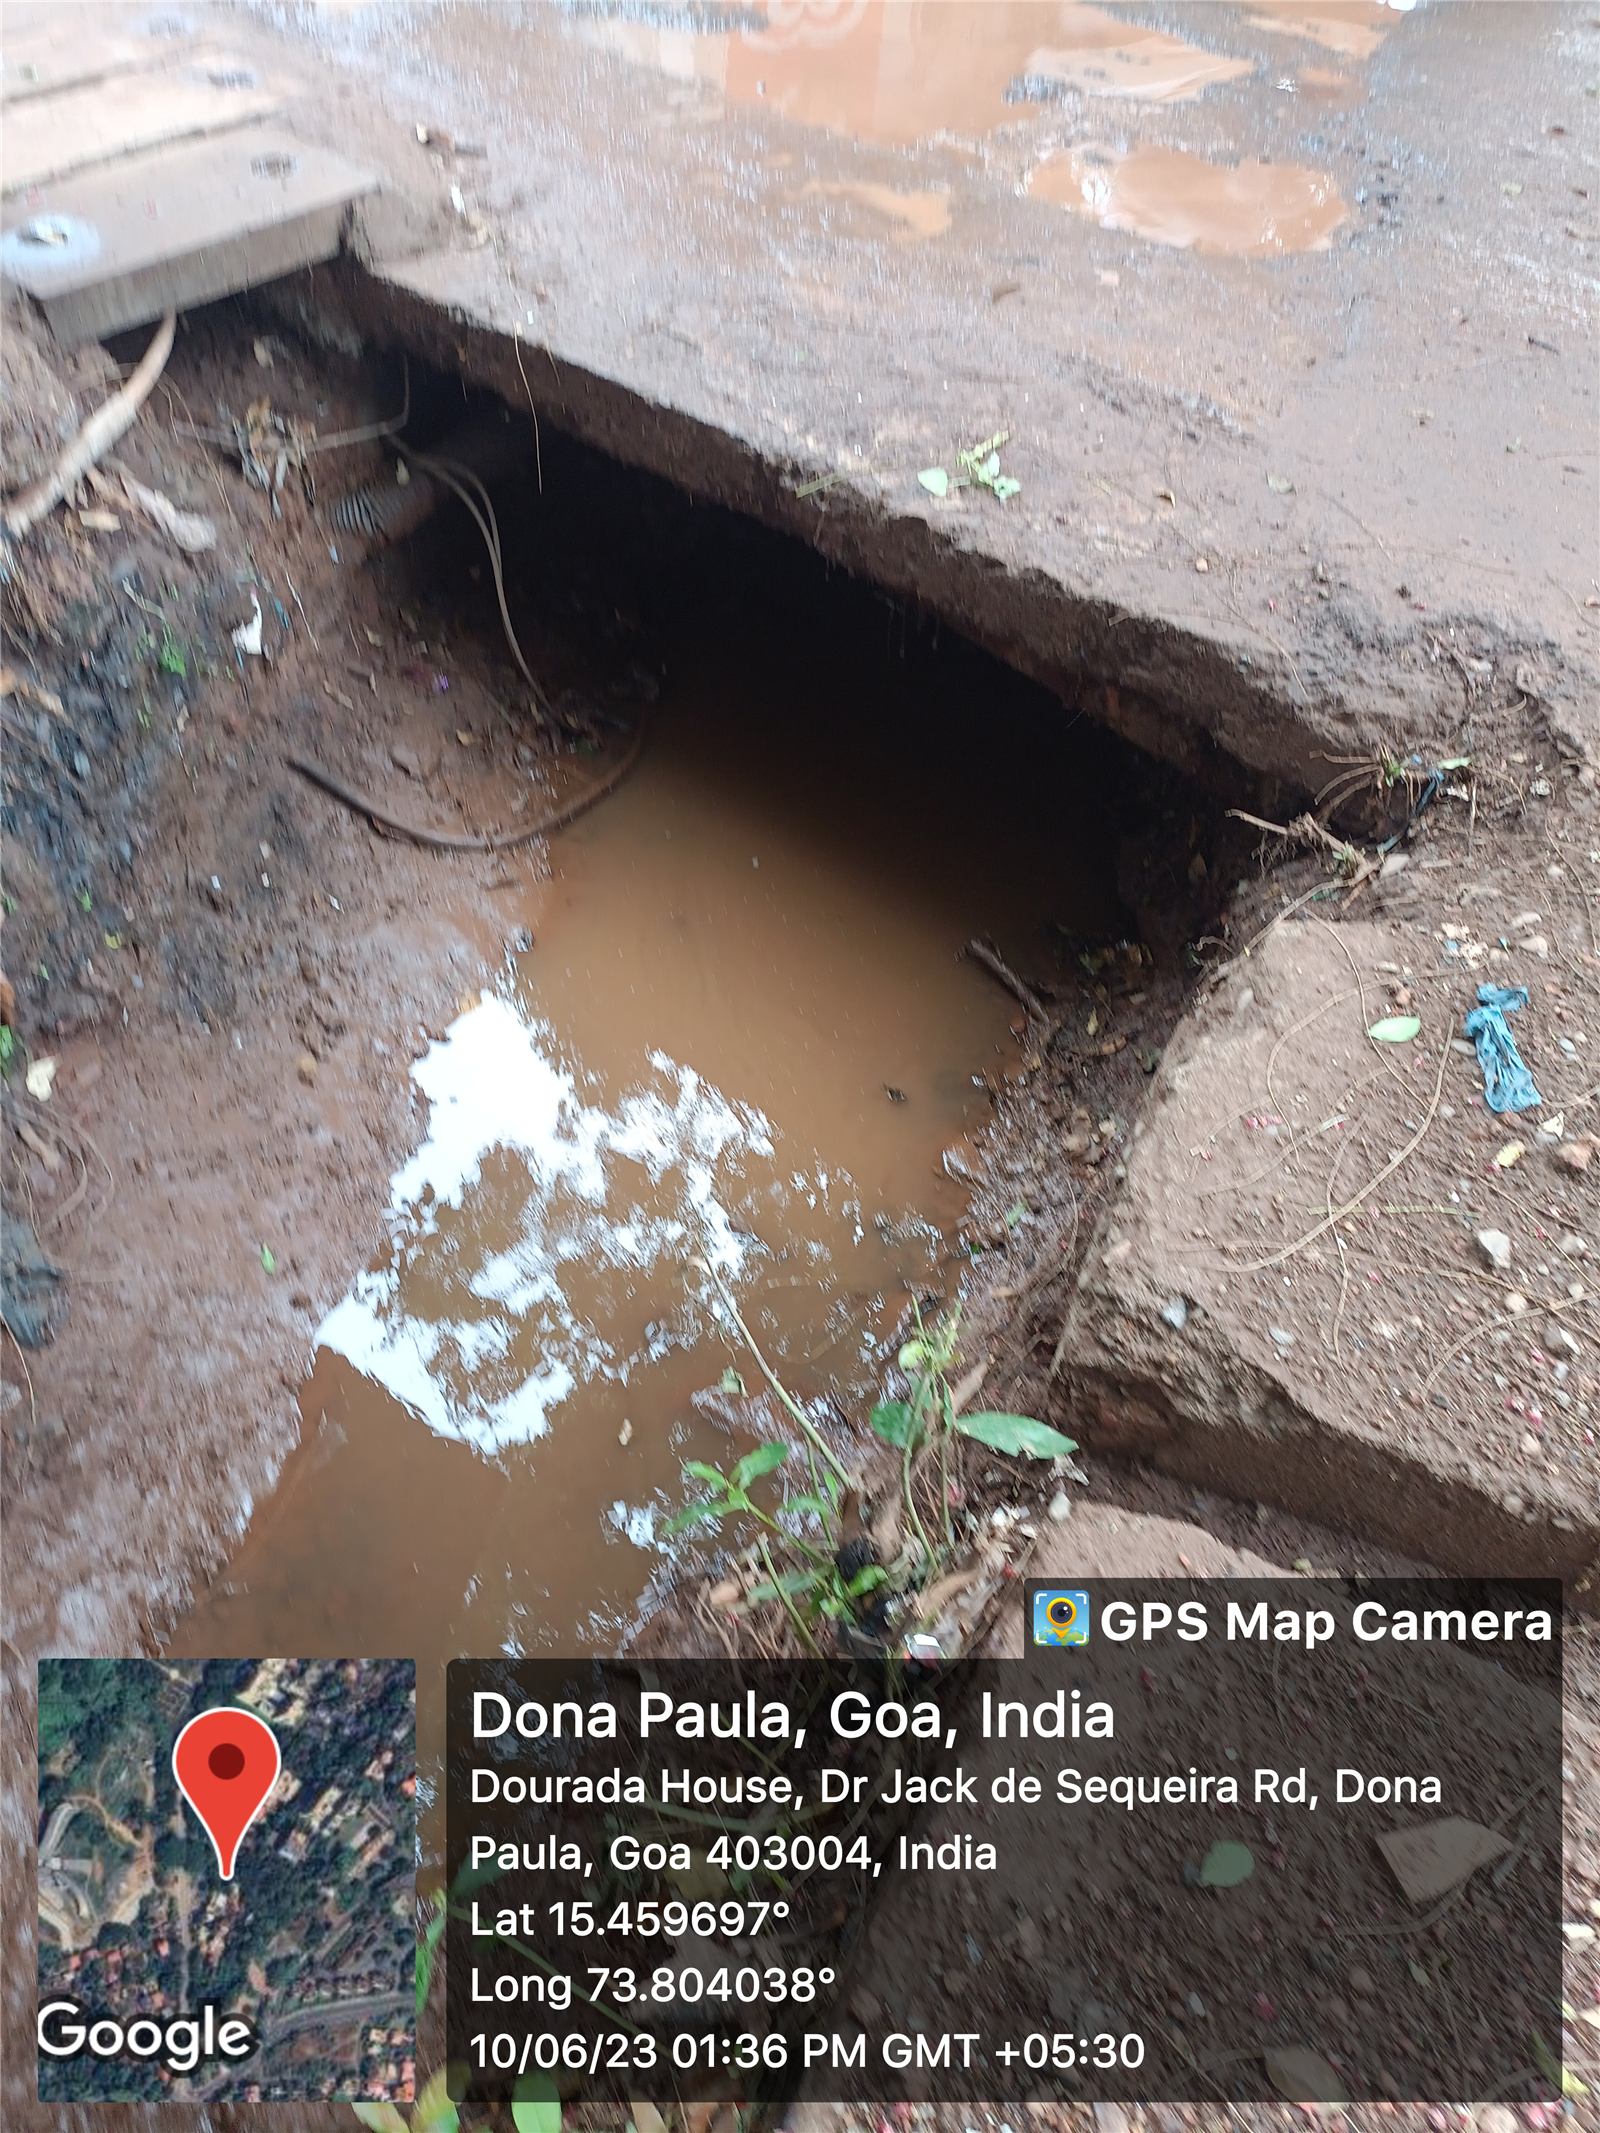
The work began on foot during the 2023 monsoon, documenting flood hotspots with GPS-tagged photographs. Those observations were laid over drainage network maps, satellite imagery, historical flood records and land-use maps, and the layers were read together for links between terrain, drains and flooding.
What the maps showed
- Low-lying Mala and Patto are especially exposed: depressed terrain right next to tidal backwaters.
- Building over khazan lands and wetlands has replaced the city's sponge with hard surfaces.
- Undersized and poorly maintained drains back up, worst when high tide and heavy rain arrive together and the water has nowhere to go.
When high tide meets heavy rain, the drains run backwards.
A drainage vulnerability overlay combined elevation, drainage density, land use and distance to tidal inlets to sort the city into high, moderate and low flood-risk zones. Together with the field evidence, it gives Panaji a clearer picture of its flood dynamics and a basis for long-term resilience planning.